pygmyplot
Introduction
Pygmyplot is a simplified wrapper around matplotlib, designed to make it easier to embed specific types of matplotlib plots into Tkinter applications while retaining matplotlib levels of configurability. The idea behind pygmyplot is similar to that of python megawidgets (PMW), although the interface to pygmyplot is not intended to be similar to PMW. The four types of plots currently supported by pygmyplot are:
- X-Y Plots
- Scatter Plots
- Histograms
- Heat Maps
Changes
- 0.2.6rc
- Updated packaging to use distribute, which allows for proper handling of dependencies with PyPI
- 0.2.2rc
- Fixed bug with heatmap labels
- From 0.2.0
- Solidified public API for distribution
- Created documentation in sphinx
- Added cushion for scatter: better limits for scatter plots.
API Documentation
Overview
At present, pygmyplot has four stable convenience functions as part of the API. These functions take minimal arguments to produce plots and return instances of MyPlot subclasses (e.g. MyXYPlot) through which the matplotlib API is accessible. Because of this accessibility, pygmyplot plots are as configurable as matplotlib plots.
Although MyPlot subclasses are defined for each type of plot, these classes are not presently part of the official pygmyplot API, so use of these classes directly is not yet supported and may affect the forward-compatibility of your code.
Several examples of pygmyplot usage follow descriptions of the convenience functions.
Convenience Functions
The four convenience functions currently in the official pygmyplot API are:
- xy_plot()
- scatter()
- histogram()
- heat_2d()
- xy_heat()
In all four functions, the master keyword argument designates the Tkinter widget that serves as the container for the resulting plot. Use of the master keyword argument is given below in the Examples. Other keyword arguments for these functions will be documented in the future.
- pygmyplot.xy_plot(x, *args, **kwargs)
Returns an instance of MyXYPlot with the data in x and *args (if supplied) plotted. This function mostly mirrors the behavior of pyplot.plot.
- pygmyplot.scatter(x, y, **kwargs)
Returns an instance of MyXYPlot with the data in x and y plotted. This function mostly mirrors the behavior of matplotlib.axes.scatter.
- pygmyplot.histogram(data, **kwargs)
Returns an instance of MyHistogram with the data (a sequence) binned and plotted.
Use the bins keword argument to control the number of bins.
- pygmyplot.heat_2d(ary2d, min_x=1, min_y=1, step_x=1, step_y=1, **kwargs)
Returns a heat-map (MyHeatMap intance) from the 2D array ary2d. Note that the first dimension is the slow dimension, and the first element of the array is placed at the bottom-left of the heat map.
The parameters min_x, min_y, step_x, step_y define how labels are generated if the keyword arguments xlabs or ylabs (the x- and y-labels) are not specified. The minima and step arguments default to 1 if not supplied.
Other keyword arguments are identical with xy_heat, except that the coarsen and heat_up arguments are not accepted for heat_2d.
- pygmyplot.xy_heat(coords, vals, coarsen=(1, 1), heat_up=1, **kwargs)
Returns a heat-map (MyHeatMap intance) with the values (vals) plotted at the positions indicated by coords, which is organized as pairs containing (x,y) coordinates, e.g:
coords = [(0, 0), (0, 1), (1, 0), (1, 2)]
vals = [5, 2, 4, 3]
For each (x,y) coordinate of data, the corresponding numerical value is plotted on the heat map at that coordinate. All unfilled positions take the minimum value of the data.
It is critical to keep in mind that coords (coordinates) are not indices. Thus a coordinate of (1,2) is actually an index (2, 1). This is an unfortunate byproduct of how matrices (and arrays, in general) are indexed.
The grid is coarsened by the pair (e.g. a 2-tuple) coarsen relative to the (x,y) positions if it is provided. This makes it possible for the (x,y) postions to have a multiplicity (e.g. 0, 4, 8 versus 0, 1, 2 in x, etc.). Thus, coarsen should divide evenly into the coordinates.
For example if coarsen is (3, 2), then the coordinates could be:
[(0,0), (0,2), (0,4), (3,0), (3,2), (3,4), (9,0), (9,2), (9,4)]
If the heat_up keyword argument is provided, then the data is heated up by that much to make the unfilled values have more contrast. This has the side-effect of reducing the range of colors in the map. The default value of heat_up is 1. To leave the background the same as the minimum, use a heat_up of 0.
The **kwargs are passed directly to the MyHeatMap initializer.
Plots
Plots are instances of MyPlot subclasses. The most useful attribute of plots is the axes attribute, which exposes the matplotlib.axes API. See the X-Y Plot example for how the axes attribute is accessed and used to modify the appearance of the plot.
Examples
The following examples are complete Tkinter programs, so may look complicated. However, only one or two lines in each example go to constructing the actual plot. To see the results, just cut-and-paste an example into a python interactive interpreter or make a .py file and run it as a python script (e.g. python xyplot_example.py).
Note that you will need matplotlib installed.
X-Y Plot
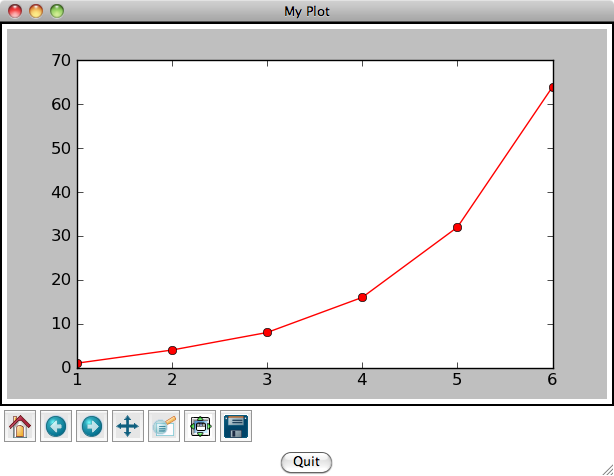
Here is an example that puts an x-y plot in a toplevel window:
import Tkinter as TK
import pygmyplot
tk = TK.Tk()
tk.title("My Plot")
x, y = ([1, 2, 3, 4, 5, 6], [1, 4, 8, 16, 32, 64])
p = pygmyplot.xy_plot(x, y, 'ro-', master=tk)
p.axes.set_ylabel('ordinate')
TK.Button(tk, text="Quit", command=tk.destroy).pack()
tk.mainloop()
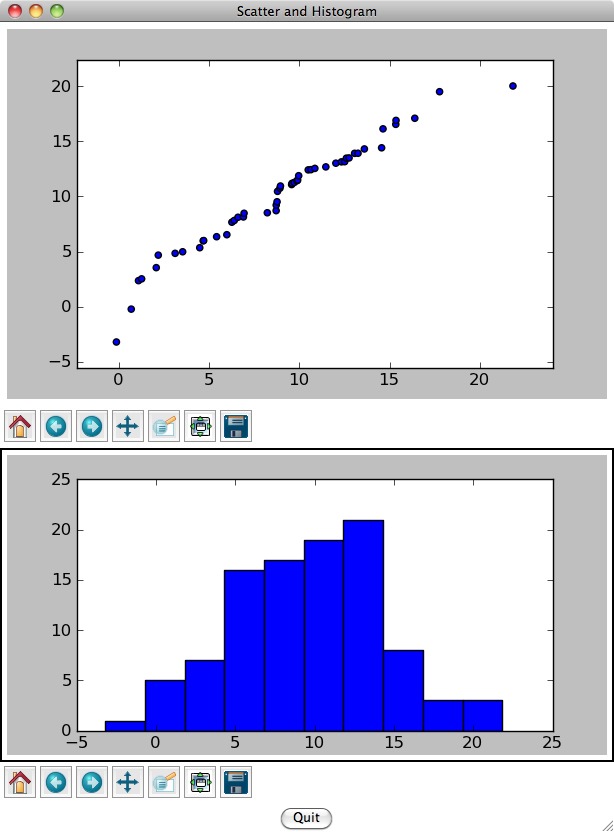
Scatter and Histogram Combo
Here, both a scatter plot and a histogram populate the same toplevel window:
import random
import Tkinter as TK
import pygmyplot
tk = TK.Tk()
tk.title("Scatter and Histogram")
data = [random.normalvariate(10, 5) for i in range(100)]
pygmyplot.scatter(sorted(data[:50]), sorted(data[50:]), master=tk)
pygmyplot.histogram(data, master=tk, bins=10)
TK.Button(tk, text="Quit", command=tk.destroy).pack()
tk.mainloop()
Heatmaps
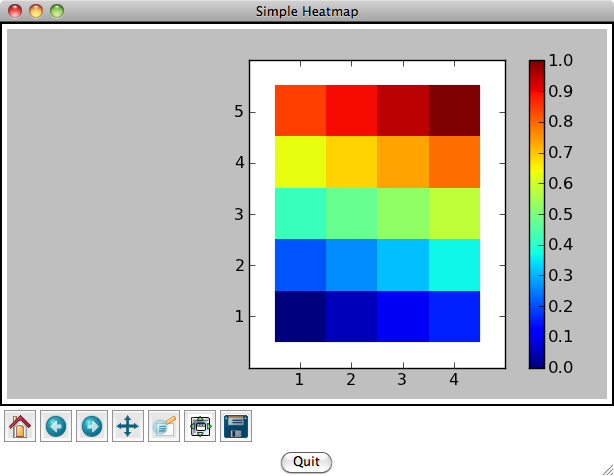
heat_2d
This is a very simple example of a heatmap using the heat_2d function. See xy_heat for a more elaborate heatmap. Note that keyword arguments for both work identically, except that the heat_up and coarsen keyword arguments are not accepted for heat_2d.
import numpy
import Tkinter as TK
import pygmyplot
tk = TK.Tk()
tk.title("Simple Heatmap")
ary = numpy.arange(20).reshape((5,4))
hm = pygmyplot.heat_2d(ary, master=tk)
TK.Button(tk, text="Quit", command=tk.destroy).pack()
tk.mainloop()
xy_heat
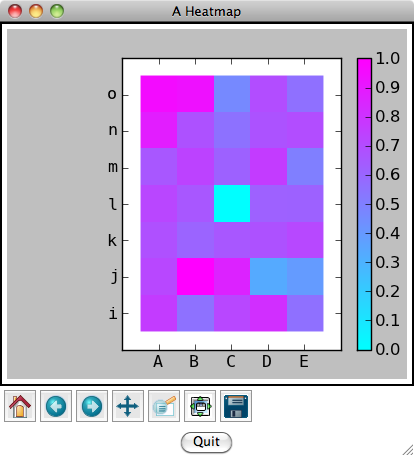
Here is an example of a heatmap in a toplevel window. Note that the coordinate and value corresponding to the central position, (2, 3), is popped, leaving it undefined and thus filled with the implicit background color (white in this example). Also note that the heat_up is a fraction (0.5), giving the map more dynamic range in color, but reducing the contrast of the positions colored in the background color with the rest of the map. Finally, the value of the cmap option is cool, which is a Matplotlib colormap. Other colormaps can be specified to improve contrast or appearance.
import random
import Tkinter as TK
import pygmyplot
tk = TK.Tk()
tk.title("A Heatmap")
# make some data
coords = []
vals = []

for i in xrange(5):
  # x coordinate is in the second dimension of an array (!)
  for j in xrange(7):
    rnum = random.normalvariate(10, 5)
    coords.append((i, j))
    vals.append(rnum)

idx_to_pop = coords.index((2, 3))
coords.pop(idx_to_pop)
vals.pop(idx_to_pop)
hm = pygmyplot.xy_heat(coords, vals, heat_up=0.5,
                       figsize=(4, 3.5),
                       xlabs=["A", "B", "C", "D", "E"],
                       ylabs=["i", "j", "k", "l", "m", "n", "o"],
                       cmap="cool",
                       master=tk)
TK.Button(tk, text="Quit", command=tk.destroy).pack()
tk.mainloop()