Introduction
Pyhull is a Python wrapper to qhull (http://www.qhull.org/) for the computation of the convex hull, Delaunay triangulation and Voronoi diagram. It is written as a Python C extension, with both high-level and low-level interfaces to qhull. It is currently based on the 2012.1 version of qhull.
Pyhull has been tested to scale to 10,000 7D points for convex hull calculations (results in ~ 10 seconds), and 10,000 6D points for Delaunay triangulations and Voronoi tesselations (~ 100 seconds). Higher number of points and higher dimensions should be accessible depending on your machine, but may take a significant amount of time.
Note
At the time of development of pyhull, the scipy.spatial package was the only other package that supports the computation of higher dimensional convex hulls. However, the version of scipy at that time (scipy 0.11.0) only supported the computation of Delaunay triangulation and the convex hull was computed from the Delaunay triangulation, which is slower and less reliable than directly computing the convex hull. As of version 0.12.0, scipy now supports the direct computation of convex hulls and is in fact ~50% faster than pyhull for larger hulls. I will still make pyhull available for the simple reason that the scipy package is fairly large and not everyone wants to install such a large package for computing hulls.
Latest Change Log
v1.5.4
- Fix minor compilation problems for Qhull on some systems.
v1.5.3
- Improve Simplex properties and performance.
v1.5.2
- Fix minor issues with compilation on Linux systems because Py3.4+ enables -Werror=declaration-after-statement by default.
- Upgrade ez_setup.py script.
Getting pyhull
Pyhull has been tested to install correctly on both BSD and POSIX systems (e.g., Mac OS X and most common Linux distros). It has not been tested on Windows as of yet. If anyone has tested it on Windows, let me know the results.
Stable version
Pyhull is now in the Python Package Index (PyPI). The version on PyPI is always the latest stable release that will be relatively bug-free. If you have setuptools or pip installed installed, you can just type:
easy_install pyhull
or:
pip install pyhull
to install pyhull with most of the dependencies set up. Otherwise, the latest stable source can be downloaded at the PyPI site as well.
Developmental version
The bleeding edge developmental version is at the public pyhull’s Github repo. The developmental version is likely to be more buggy, but may contain new features. Note that the GitHub versions include test files as well for unit testing.
From the source, you can type:
python setup.py install
or to install the package in developmental mode:
python setup.py develop
Using pyhull
It is generally recommended that you use the high-level wrapper functions and classes in pyhull.
For useful analysis outputs, please use the high-level ConvexHull, DelaunayTri and VoronoiTess classes in the convex_hull, delaunay and voronoi modules respectively. For example,
>>> from pyhull.convex_hull import ConvexHull
>>> pts = [[-0.5, -0.5], [-0.5, 0.5], [0.5, -0.5], [0.5, 0.5], [0,0]]
>>> hull = ConvexHull(pts)
>>> hull.vertices
[[0, 2], [1, 0], [2, 3], [3, 1]]
>>> hull.points
[[-0.5, -0.5], [-0.5, 0.5], [0.5, -0.5], [0.5, 0.5], [0, 0]]
>>>
>>> from pyhull.delaunay import DelaunayTri
>>> tri = DelaunayTri(pts)
>>> tri.vertices
[[2, 4, 0], [4, 1, 0], [3, 4, 2], [4, 3, 1]]
>>> tri.points
[[-0.5, -0.5], [-0.5, 0.5], [0.5, -0.5], [0.5, 0.5], [0, 0]]
>>>
>>> from pyhull.voronoi import VoronoiTess
>>> v = VoronoiTess(pts)
>>> v.vertices
[[-10.101, -10.101], [0.0, -0.5], [-0.5, 0.0], [0.5, 0.0], [0.0, 0.5]]
>>> v.regions
[[2, 0, 1], [4, 0, 2], [3, 0, 1], [4, 0, 3], [4, 2, 1, 3]]
The figure below is a plot of the output from pyhull for a set of 30 random 2D points. To see a sample of the code of how this graph is generated, check out the pyhull_demo.py script on the Github page.
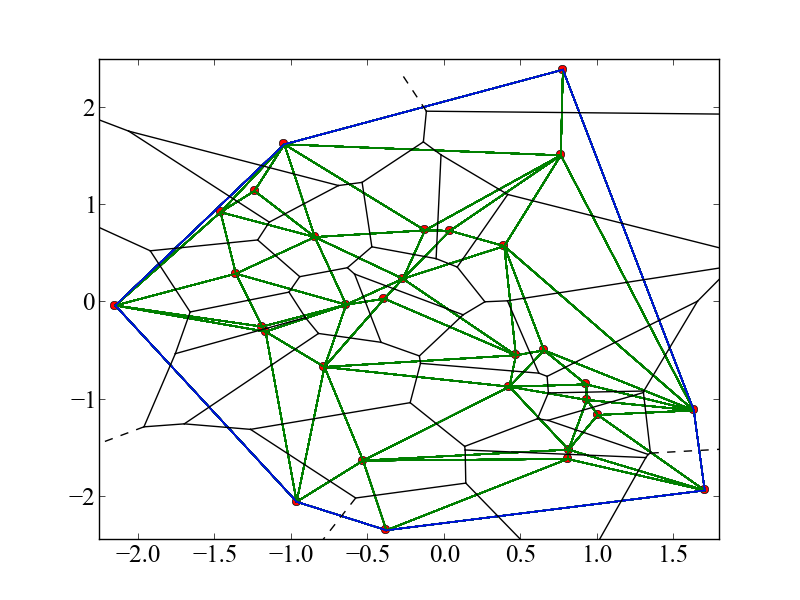
Plot of pyhull output on a set of 30 random 2D points. Red dots - points. Green lines - Delaunay triangulation. Blue lines - convex hull. Black lines - Voronoi tessellation. Dash black lines - Voronoi tessellation with points at infinity.
If you need more detailed output, consider using the lower-level interface functions that are modelled after standard command line syntax of various qhull programs:
>>> from pyhull import qconvex, qdelaunay, qvoronoi
>>>
>>> pts = [[-0.5, -0.5], [-0.5, 0.5], [0.5, -0.5], [0.5, 0.5], [0,0]]
>>>
>>> qconvex("i", pts)
['4', '0 2', '1 0', '2 3 ', '3 1']
>>>
>>> qdelaunay("i", pts)
['4', '2 4 0', '4 1 0', '3 4 2', '4 3 1']
>>>
>>> qvoronoi("o", pts)
['2', '5 5 1', '-10.101 -10.101', '0   -0.5', '-0.5      0', '0.5      0', '0    0.5', '3 2 0 1', '3 4 0 2', '3 3 0 1', '3 4 0 3', '4 4 2 1 3']
The return values are simply a list of strings from the output.
Performance of Pyhull
The table below indicates the time taken in seconds to generate the convex hull for a given number of points in a specified number of dimensions. The final col (Cmd-line qconvex) is the time taken to generate the data using a subprocess call to command line qconvex as a comparison for pyhull. Note that these are based on older versions of scipy (< 0.12.0) where the hull is computed by first performing the Delaunay triangulation.
| No of points | Dim | scipy | pyhull | Cmd line |
|---|---|---|---|---|
| 100 | 3 | 0.00237 | 0.00209 | 0.01354 |
| 100 | 4 | 0.00609 | 0.00333 | 0.01053 |
| 100 | 5 | 0.03125 | 0.00834 | 0.01743 |
| 100 | 6 | 0.16662 | 0.04627 | 0.05048 |
| 1000 | 3 | 0.02543 | 0.01166 | 0.01398 |
| 1000 | 4 | 0.15308 | 0.01438 | 0.01741 |
| 1000 | 5 | 1.04724 | 0.05105 | 0.05279 |
| 1000 | 6 | 7.45985 | 0.25104 | 0.29058 |
| 2000 | 3 | 0.05124 | 0.01968 | 0.02431 |
| 2000 | 4 | 0.32277 | 0.02326 | 0.02742 |
| 2000 | 5 | 2.38308 | 0.06664 | 0.06845 |
| 2000 | 6 | 20.64062 | 0.41188 | 0.42673 |
Here are new benchmarks for pyhull against scipy 0.12.0, which supports the direct computation of the convex hull.
| Npts | Dim | scipy | pyhull |
|---|---|---|---|
| 100 | 3 | 0.00044 | 0.00120 |
| 100 | 4 | 0.00062 | 0.00215 |
| 100 | 5 | 0.00347 | 0.00838 |
| 100 | 6 | 0.01382 | 0.03698 |
| 1000 | 3 | 0.00051 | 0.00778 |
| 1000 | 4 | 0.00194 | 0.01226 |
| 1000 | 5 | 0.01417 | 0.04079 |
| 1000 | 6 | 0.14036 | 0.20594 |
| 2000 | 3 | 0.00072 | 0.01772 |
| 2000 | 4 | 0.00392 | 0.02941 |
| 2000 | 5 | 0.02350 | 0.07712 |
| 2000 | 6 | 0.25601 | 0.36650 |
The figures below show the scaling of the ConvexHull, DelaunayTri and VoronoiTess classes with number of points and dimension of points. You may use the numbers below to estimate how long the code will take for your specific use cases.
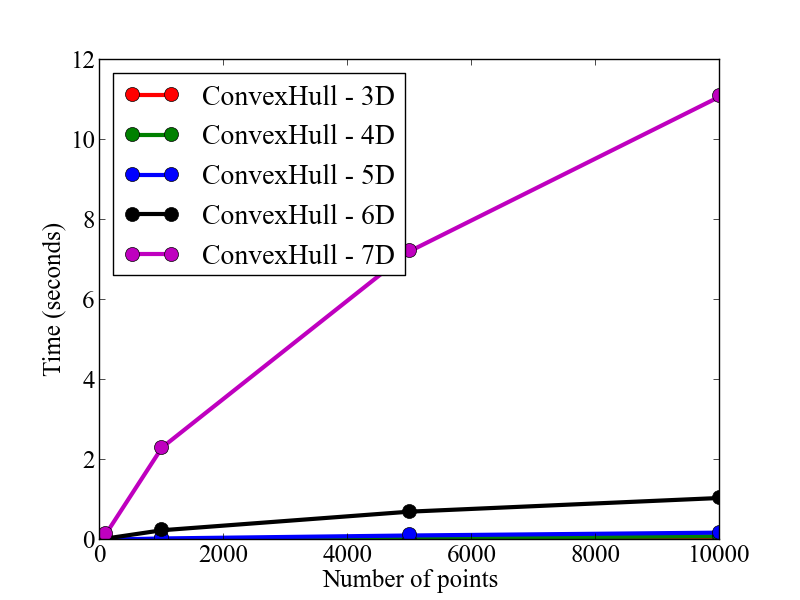
Scaling of ConvexHull with number of points and dimension of points.
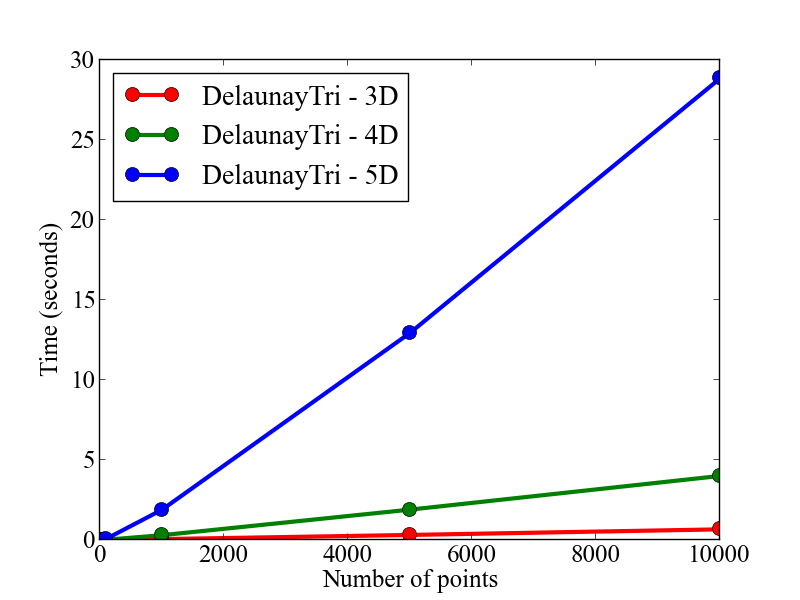
Scaling of DelaunayTri with number of points and dimension of points.
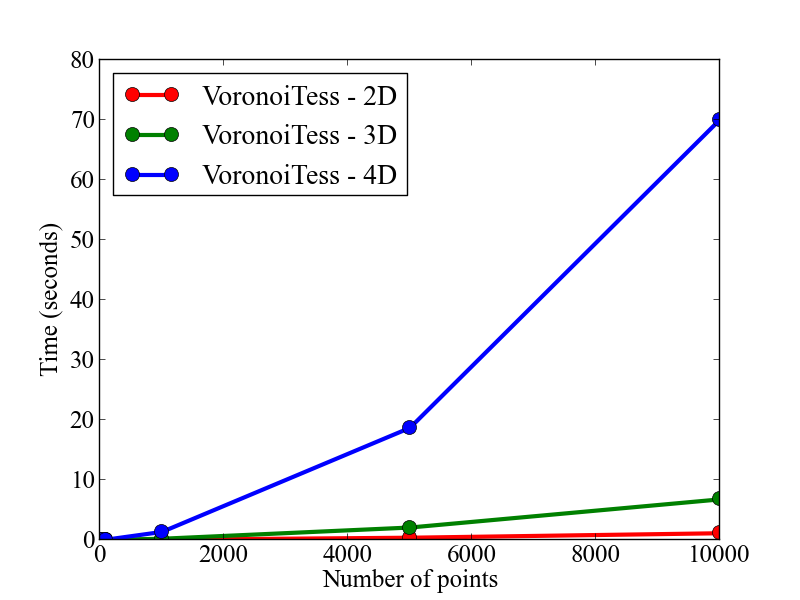
Scaling of VoronoiTess with number of points and dimension of points.
Bug reports / new features
- Report issues and bugs. A simple way that anyone can contribute is simply to report bugs and issues to the developing team. You can submit an Issue in our github page.
- Submitting new code. Another way to contribute is to submit new code/bugfixes to pyhull. While you can always zip your code and email it to the maintainer of pyhull, the best way for anyone to develop pyhull is by adopting the collaborative Github workflow.
API/Reference Docs
The API docs are generated using Sphinx auto-doc and outlines the purpose of all modules and classes, and the expected argument and returned objects for most methods. They are available at this link below
License
Pyhull is released under the MIT License. The terms of the license are as follows:
The MIT License (MIT)
Copyright (c) 2011-2012 MIT

Permission is hereby granted, free of charge, to any person obtaining a copy
of this software and associated documentation files (the "Software"), to deal
in the Software without restriction, including without limitation the rights
to use, copy, modify, merge, publish, distribute, sublicense, and/or sell
copies of the Software, and to permit persons to whom the Software is
furnished to do so, subject to the following conditions:

The above copyright notice and this permission notice shall be included in
all copies or substantial portions of the Software.

THE SOFTWARE IS PROVIDED "AS IS", WITHOUT WARRANTY OF ANY KIND, EXPRESS OR
IMPLIED, INCLUDING BUT NOT LIMITED TO THE WARRANTIES OF MERCHANTABILITY,
FITNESS FOR A PARTICULAR PURPOSE AND NONINFRINGEMENT. IN NO EVENT SHALL THE
AUTHORS OR COPYRIGHT HOLDERS BE LIABLE FOR ANY CLAIM, DAMAGES OR OTHER
LIABILITY, WHETHER IN AN ACTION OF CONTRACT, TORT OR OTHERWISE, ARISING FROM,
OUT OF OR IN CONNECTION WITH THE SOFTWARE OR THE USE OR OTHER DEALINGS IN THE
SOFTWARE.