1. Quick Start
Contents
1.1. Running R code
This can be easily done using rcode() function:
>>> a = rcode("a = matrix(c(1,2,3,4), nrow=2)")
>>> print(a)
     [,1] [,2]
[1,]    1    3
[2,]    2    4
This function uses RPy2 and therefore starts a R session behind the scene. See RPy2 documentation for more details.
1.2. Install a R package from bioconductor
from rtools import biocLite
biocLite("CellNOptR")
1.3. Install a local R package (tar.gz) or from a URL
As an example, the local file is built using the following command in the source directory:
R CMD build .
Then, you can install the file as follows:
from rtools import install_packages
install_packages("local_file.tar.gz)
1.4. Use the RPackageManager
You can manage your R packages from python using the RPackageManager. For instance you can check that the base package is installed:
>>> from rtools import RPackageManager
>>> pm = RPackageManager()
>>> pm.require("base", "1.0")
True
and link to it directly from Python or check its version:
>> p = pm["base"]  # returns a RPackage instance
>>> p.version
'2.15.2'
>>> p.package # a direct access to the entire R package
You can also look at all packages installed:
>>> print pm.packages # alias to
>>> pm.installed['Package']
or install a new package using biocLite or CRAN (replaces the functions biocLite and install_package here above:
>>> pm.install_packages("base")
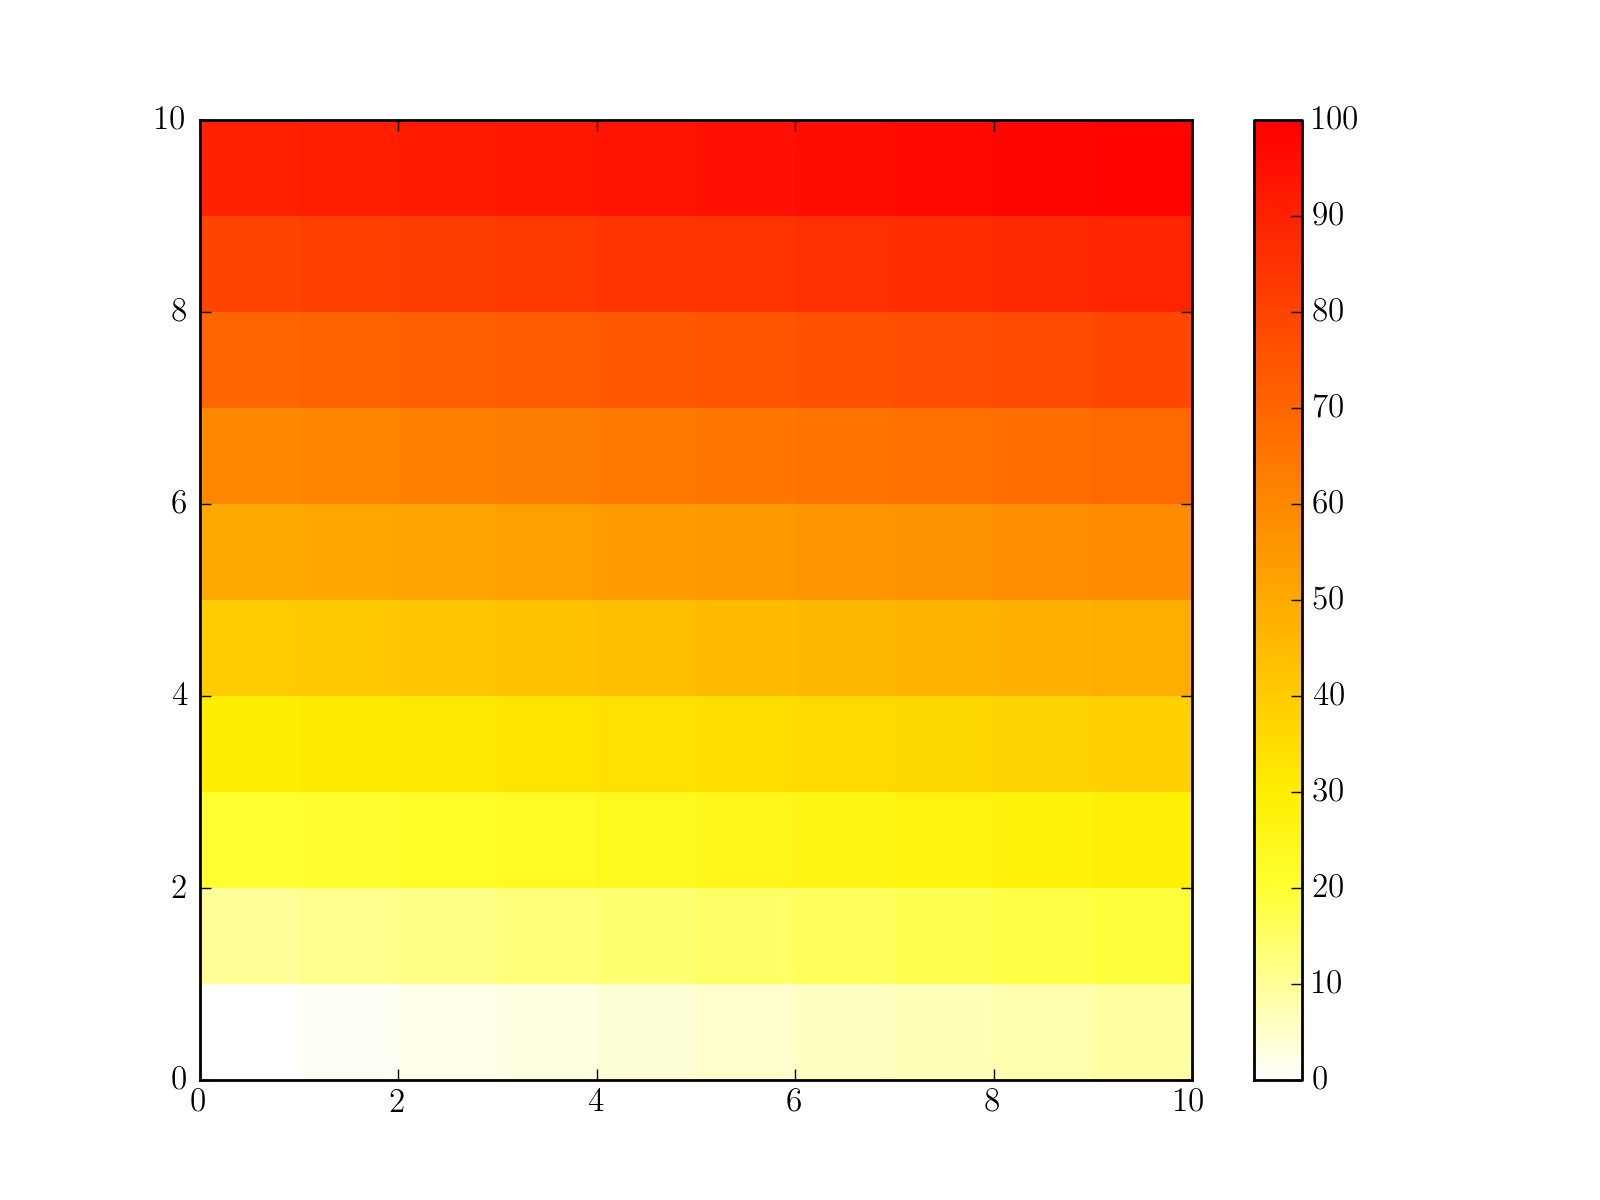
1.5. Build a matplotlib colormap similar to a R colormap
Create a colormap to be used in matplotlib using RColorMap. See the code below for an example.
# build the matplotlib colormap from a R colormap
from rtools import *
rmap = RColorMap("heat")    # heat is a valid R colormap
cmap = rmap.colormap()      # extract the matplotlib colormap

# use the colormap
A = np.array(range(100))
A.shape = (10,10)
plt.pcolor(A,cmap=cmap, vmin=0, vmax=100)
plt.colorbar()
(Source code, png, hires.png, pdf)

1.6. Wrapper around a S4 class
Suppose, you have a S4 class in R and you want to access an attribute, first, you need to know the slot name, and then call do_slot method.
The S4Class class fetches all the slot names and creatse attributes so as to ease the manipulation of S4 object within python. Consider the following class declaration and instanciation:
robject = rcode("""
    setClass("Person",
        representation(name = "character", age="numeric"));
    hadley <- new("Person", name = "Hadley", age = 31)""")
Then, you can use it as an input to the S4Class and access to the attributes as follows:
pobject = S4Class(robject)
pobject.age == 31 # True
pobject.name
1.7. Loading a R package
You can load a R package and therefore provide access to all its functionalities using RPackage via the attribute package:
from rtools import RPackage
rbase = RPackage("base")
rbase.version
rbase.package.weekdays
A useful argument is the require argument to specify a version (a string):
rbase = RPackage("CellNOptR", require="1.0.0")
You can even install it from BioConductor if needed:
rbase = RPackage("CellNOptR", require="1.0.0", install=True)
Warning
if install mode is True, does not yet check for correct version.
1.8. Calling R plot and saving results in a file
from rtools import *
rp = Rplot(show=False, output="test.png")
rp.rcode("plot(c(1,2))")


# would be handy to have this functionality but does not seem to work right now
##def python_func():
#    from rtools import rcode
#    rcode("plot(c(1,2))")
#
#rp = Rplot(show=True, output="test2.png")
#rp.pythoncode("python_func()")

from pylab import imread, imshow
imshow(imread("test.png"))
import os
os.remove("test.png")
#os.remove("test2.png")
(Source code, png, hires.png, pdf)